

December 27, 2022
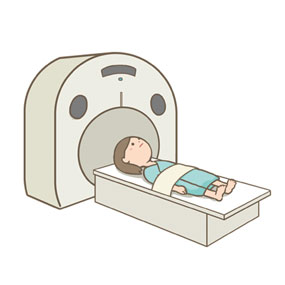
What is an MRI?
Unlike X-rays or CT scans, MRI does not use radiation.
It creates images using magnetic fields and radio waves, which means there is no radiation exposure.
While it eliminates radiation exposure, drawbacks include longer examination times and loud noise.
Here is a guide to interpreting basic MRI images, specifically focusing on the lumbar spine.
The Three Basic Imaging Planes
MRI images are typically interpreted from three different directions, allowing a three-dimensional understanding of anatomical structures and abnormalities.
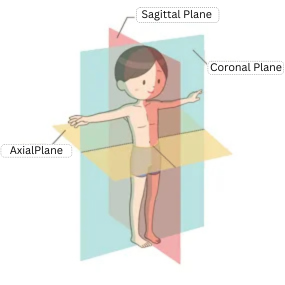
Sagittal Plane: Divides the body into left and right halves (side view).
Axial Plane: Divides the body into upper and lower sections (cross-sectional view).
Coronal Plane: Divides the body into front and back sections (frontal view).
These are the three basic imaging planes.
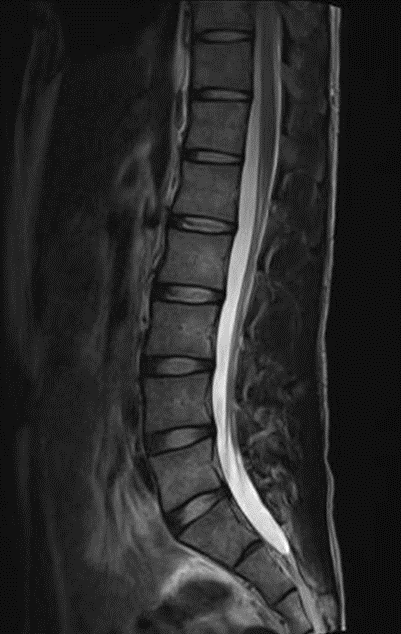
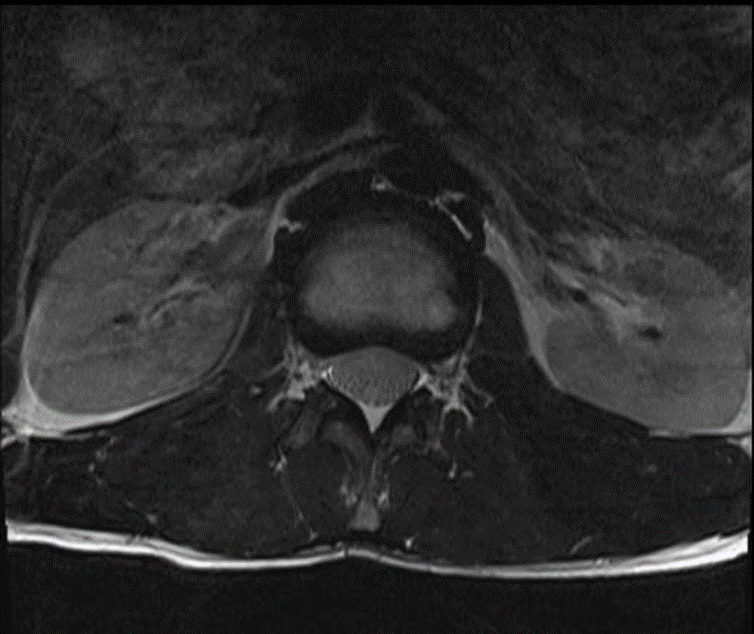
Below are practical examples using lumbar spine MRI images.
Sagittal Plane
Axial Plane
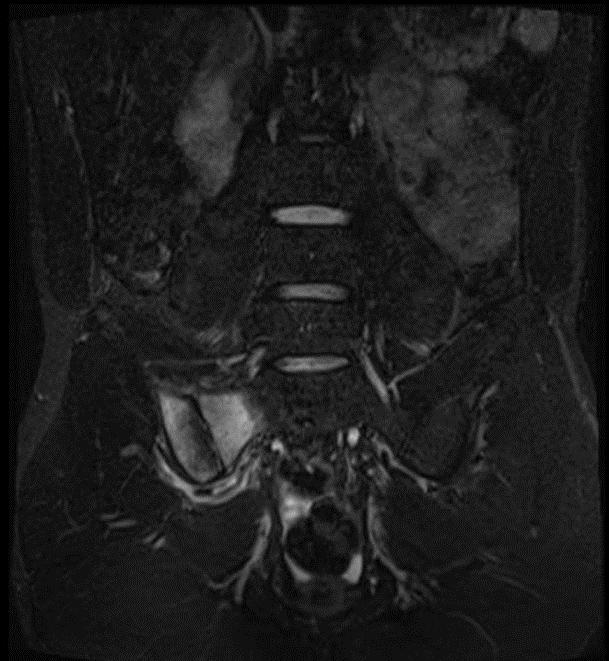
Coronal Plane
Understanding MRI Signal Intensity / T1, T2, and STIR (Fat Suppression)
MRI creates images by manipulating the magnetic properties of water molecules in the body.
Different sequences (T1, T2, and STIR) can be adjusted to change signal intensity, to make certain tissues appear brighter or darker based on water and fat content.
Areas with weaker signals appear black, while areas with stronger signals appear white in the image.
In other words, the findings are identified by analyzing differences in signal intensity and color contrast.
T1, T2, and STIR (fat suppression) each show different signal intensity patterns.
The following table summarizes the typical signal intensity of key structures in the lumbar spine.
| Body Site | T1-weighted (T1) | T2-weighted (T2) | STIR (Fat Suppression) |
| Vertebral Body | High Signal (White) | Intermediate Signal (Gray) | Low Signal (Black) |
| Spinal Canal / CSF | Low Signal (Black) | High Signal (White) | High Signal (White) |
| Intervertebral Disc | Intermediate Signal (Gray) | Intermediate Signal (Gray) | High Signal (White) |
| Fat | High Signal (White) | Intermediate Signal (Gray) | Low Signal (Black) |
* Signal intensity may vary depending on pathological conditions (e.g., inflammation, edema).
By examining the images below, you can see how the contrast changes between sequences.
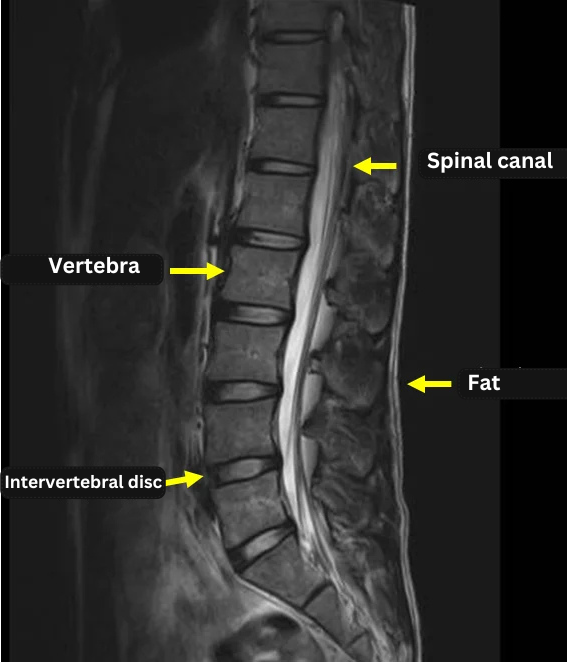
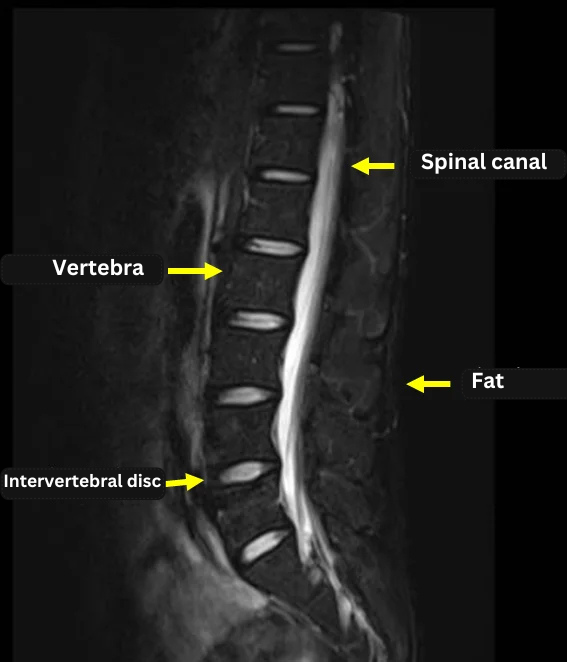
(All three images were taken in the sagittal plane.)
T1 Imaging: Vertebral bodies (containing fat) appear bright (white). Spinal fluid is dark.

T2 Imaging: Spinal fluid (CSF) within the spinal canal appears bright (white), making it ideal for visualizing the spinal cord and nerves.
STIR Image (Fat Suppression): Fat is suppressed (dark/black), which is useful for highlighting areas of edema or inflammation (which appear brighter).
The above images represent typical normal MRI findings.
We hope this explanation helps you better understand the general concepts behind MRI imaging.
Reviewing these examples will help you better understand your own MRI scans in the future.
Our clinic offers a free MRI review service.
If you already have lumbar MRI images taken at another facility, please feel free to contact us.
* Please provide us with MRI data taken within the last 3 months.
Author: The Staff at ILC International Lumbago Clinic Tokyo